With much interest I've been following the posts on testing coils and load matching the alternator/prop. This is the 1st attempt in applying the information to my project. Thanks to all who contribute to this form. Please review and point out errors, omissions and any improvements that can be made. Boy, I'm having fun learning this stuff.
Here is background information on the project/experiment:
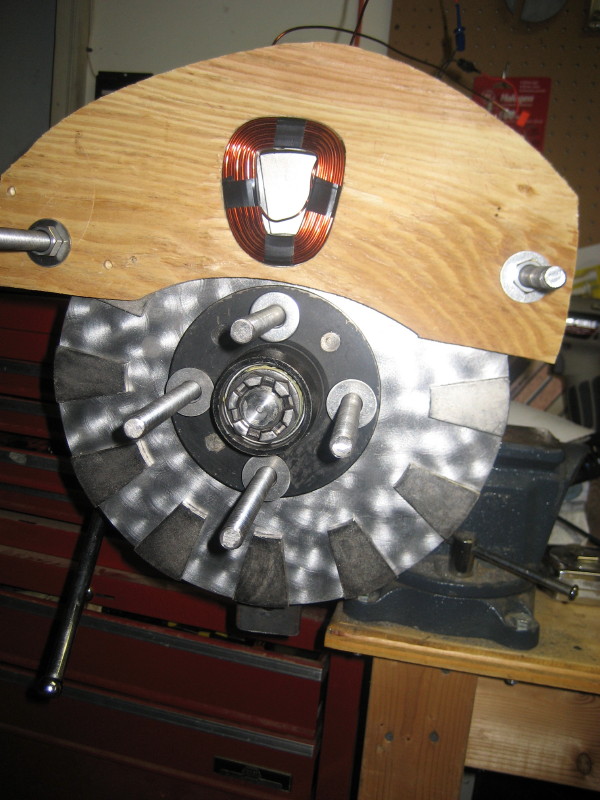
Magnets: 24 - ¼" wedge (Windstuffnow)
Poles: 12
Rotor size: 12"
Magnet Wire 14 awg
Stator: 9 coils, 3 phase wired star
System Volts 24
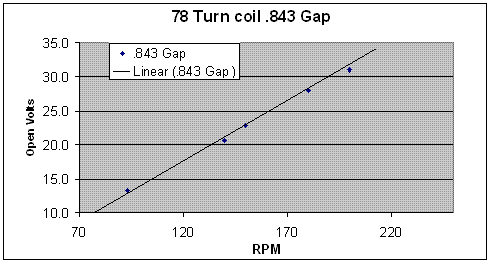
Below is a graph plotting data from of the 1st test coil of 78 turns. Open volts were calculated from multimeter rms readings. Open volts= (volts rms)3*1.41*1.73-1.4

Next, 6 turns were removed off the coil. This time the air gap between the magnets were varied and data was collected. The gap between the magnets were 0.843",0.770" and 0.715".

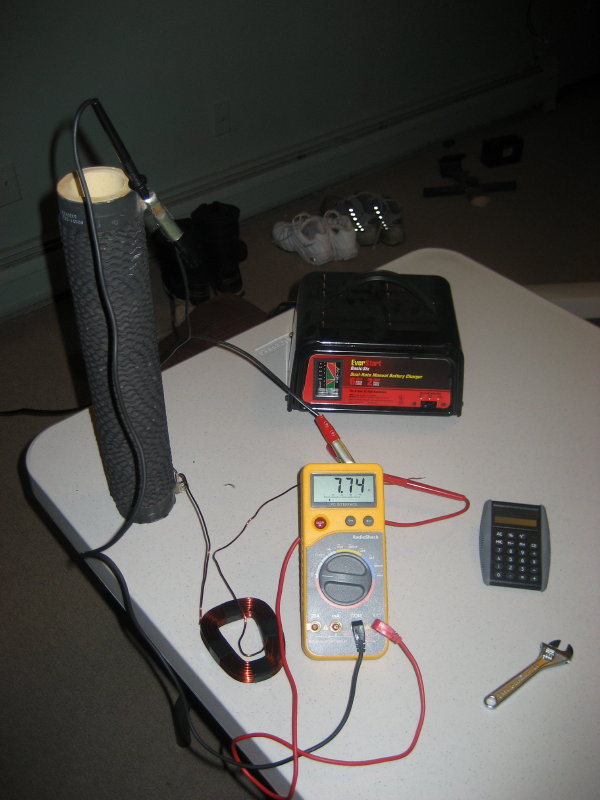
The resistance of the test coil was first estimated based on weight. 14 awg wire is 0.203 ohms/lb and the 72 turn coil weighs 301.7g. (301.7 g / 453.6 g/lb) * 0.203 ohms/lb = 0.135 ohms. The resistance was also checked by voltage drop across the coil on a measured load. When the coil was at room temperature a resistance of .137 ohms was obtained. Then the coil was heated-up by shorting the leads with the battery charger for a minute or so, until the coil was fairly warm to the touch. The resistance of the warm coil increased to .180 ohms.

Now for the complicated mysterious part, "Estimating" alternator performance and then matching a prop. Here are some definitions and assumptions used.
Input power = Output + Losses
Stator Loss = Current^2 * Winding R
Star Winding R = Sum of the resistance of 2 phases
Output = [(Open dcv - Charge dcv)(Winding R * cf)] * Charge dcv
Cf (Correction factor )= 1.3 (based on Flux's experience)
Prop Cp at different TSR,
.12 4
.20 5
.35 6
.4 7
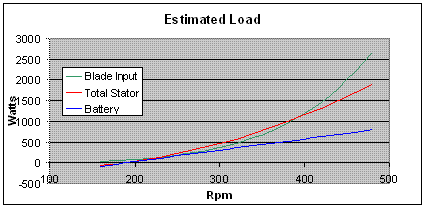
Taking the above assumptions and creating a spreadsheet produced the next graph.

The Excel spreadsheet is uploaded into my files for review.
The cells in blue represent data measured off the test coils. The cells in yellow are set-up as variable inputs.
I have no idea how correct and/or accurate the spreadsheet came out. Hopefully, with some of your input it can be improved. The spreadsheet has been educational for me to see graphically the effect changing a variable has. Most notable, how adding resistance or opening the magnet gap can move the system out of a slow speed stall. Initially I had a hard time grasping this concept, which is mentioned in several post.
Here is some explanation on the spreadsheet:
-Test coil vac based on test coil regression analysis (acv/rpm input)
-Open vdc based on 3 coils/phase in star, rms conversion, and
then subtracts off rectifier and line loss.
-Output amp (Open vdc - Charging vdc)
resistance
-Battery Watts amps
charging vdc
-System Heat (amp^2)* corrected resistance
-Stator Input Battery + System Heat
One of the short coming of the spreadsheet it does not factor in resistance will be increasing as the stator heats up.
Questions so far:
1. Is the Cp vs TSR assumption reasonable for a 2.4m prop? Does anyone have any
real world data?
2. Does the rectifier and line losses need to be added independently as part of the
Stator Input, or are they accounted for in the Open vdc calculation?
3. If a boost 12vdc converter is used, what is recommended for the cut-in rpm
on the main rectifier?
Thanks,
Boondocker